Learn about optimal javelin throw angles, height of throw, and the relationship between the two with this Summer Olympics optimal throw javelin angle measurement activity.
This sports STEM activity challenges students to measure the height of release and angle of release to determine whether an athlete is in position for an optimal javelin throw.

Common Core Standards Math
This activity supports the following CCSS math standards.
CCSS4.MD.C.6 – Measure angles in whole-number degrees using a protractor. Sketch angles of specified measure.
CCSS4.MD.C.5 – Recognize angles as geometric shapes that are formed wherever two rays share a common endpoint, and understand concepts of angle measurement.
What is a Javelin?
A javelin is a light spear that is thrown by hand for sport. In Ancient Greece, the javelin was used as a weapon and later evolved into a sports event and one of the Athletics field events in the modern Olympic Games.
How do you throw a javelin?
To throw a javelin, an athlete holds the javelin in one arm and throws it as far as possible while running. A javelin can reach speeds up to 100km/h (about 62mph).
The world record for the javelin throw is 98.48m set by Jan Železný in 1996. The Tokyo 2020 Summer Olympics features Johannes Vetter who has thrown more than 90m seven times this year.
How do Angles affect Javelin Throws?
According to a case study published by Quintic Sports, the optimal release angle of the javelin throw is between 34° to 36°. Taller javelin athletes should decrease the angle of release and shorter javelin athletes should increase the angle of release.
The distance that a javelin travels depends on the speed that the javelin is thrown at, the angle of release, the height that the javelin is released from the ground, and the acceleration due to gravity.
This post contains affiliate links. As an Amazon Associate, Our Family Code earns from qualifying purchases. Please see our Disclosure Policy for more details.
Optimal Javelin Throw Angle Measurement
This activity is designed to follow a similar method that the researchers used to help determine the optimal release angle of a javelin throw by calculating the angle of release to make deductions about the relationship between the height of release and the angle measurement at that height.
You’ll need the following materials:
- Ruler
- Protractor (if you don’t have a protractor, we’ve included a printable one in the workbook as well!)
- Optimal Throw Javelin Analysis Worksheets (grab these for free at the end of this post!)
Optional:
- Pool noodle, broom, or large stick
- Tape measure
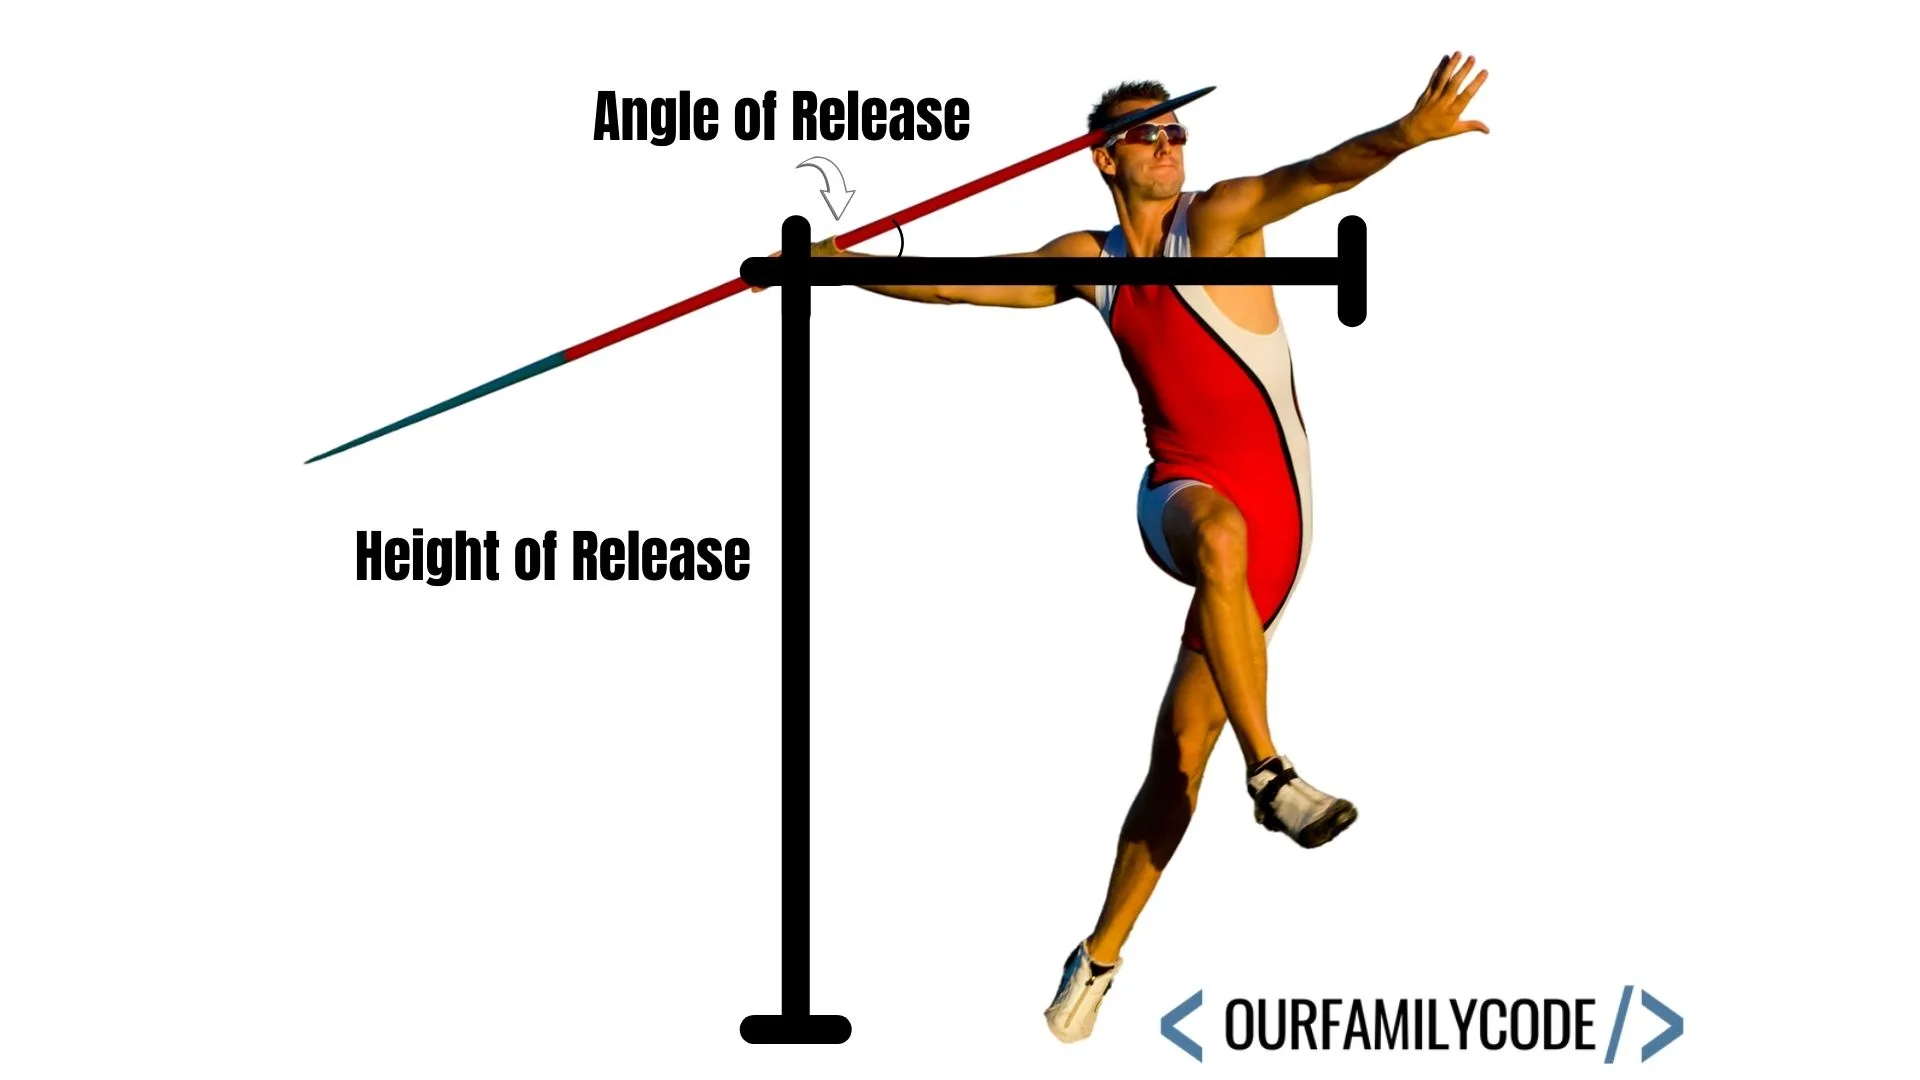
What is the Height of Release in the Javelin Throw
The height of release is the distance from where the hand is holding the javelin to the ground. The height of release is provided (in inches) on the worksheets for each javelin athlete in the table on the first page.
If the relative height of the javelin increases, the angle of release should decrease. If the relative height of the javelin decreases, the angle of release should increase. This helps for athletes to make adjustments to the angle of release based on their height as well.
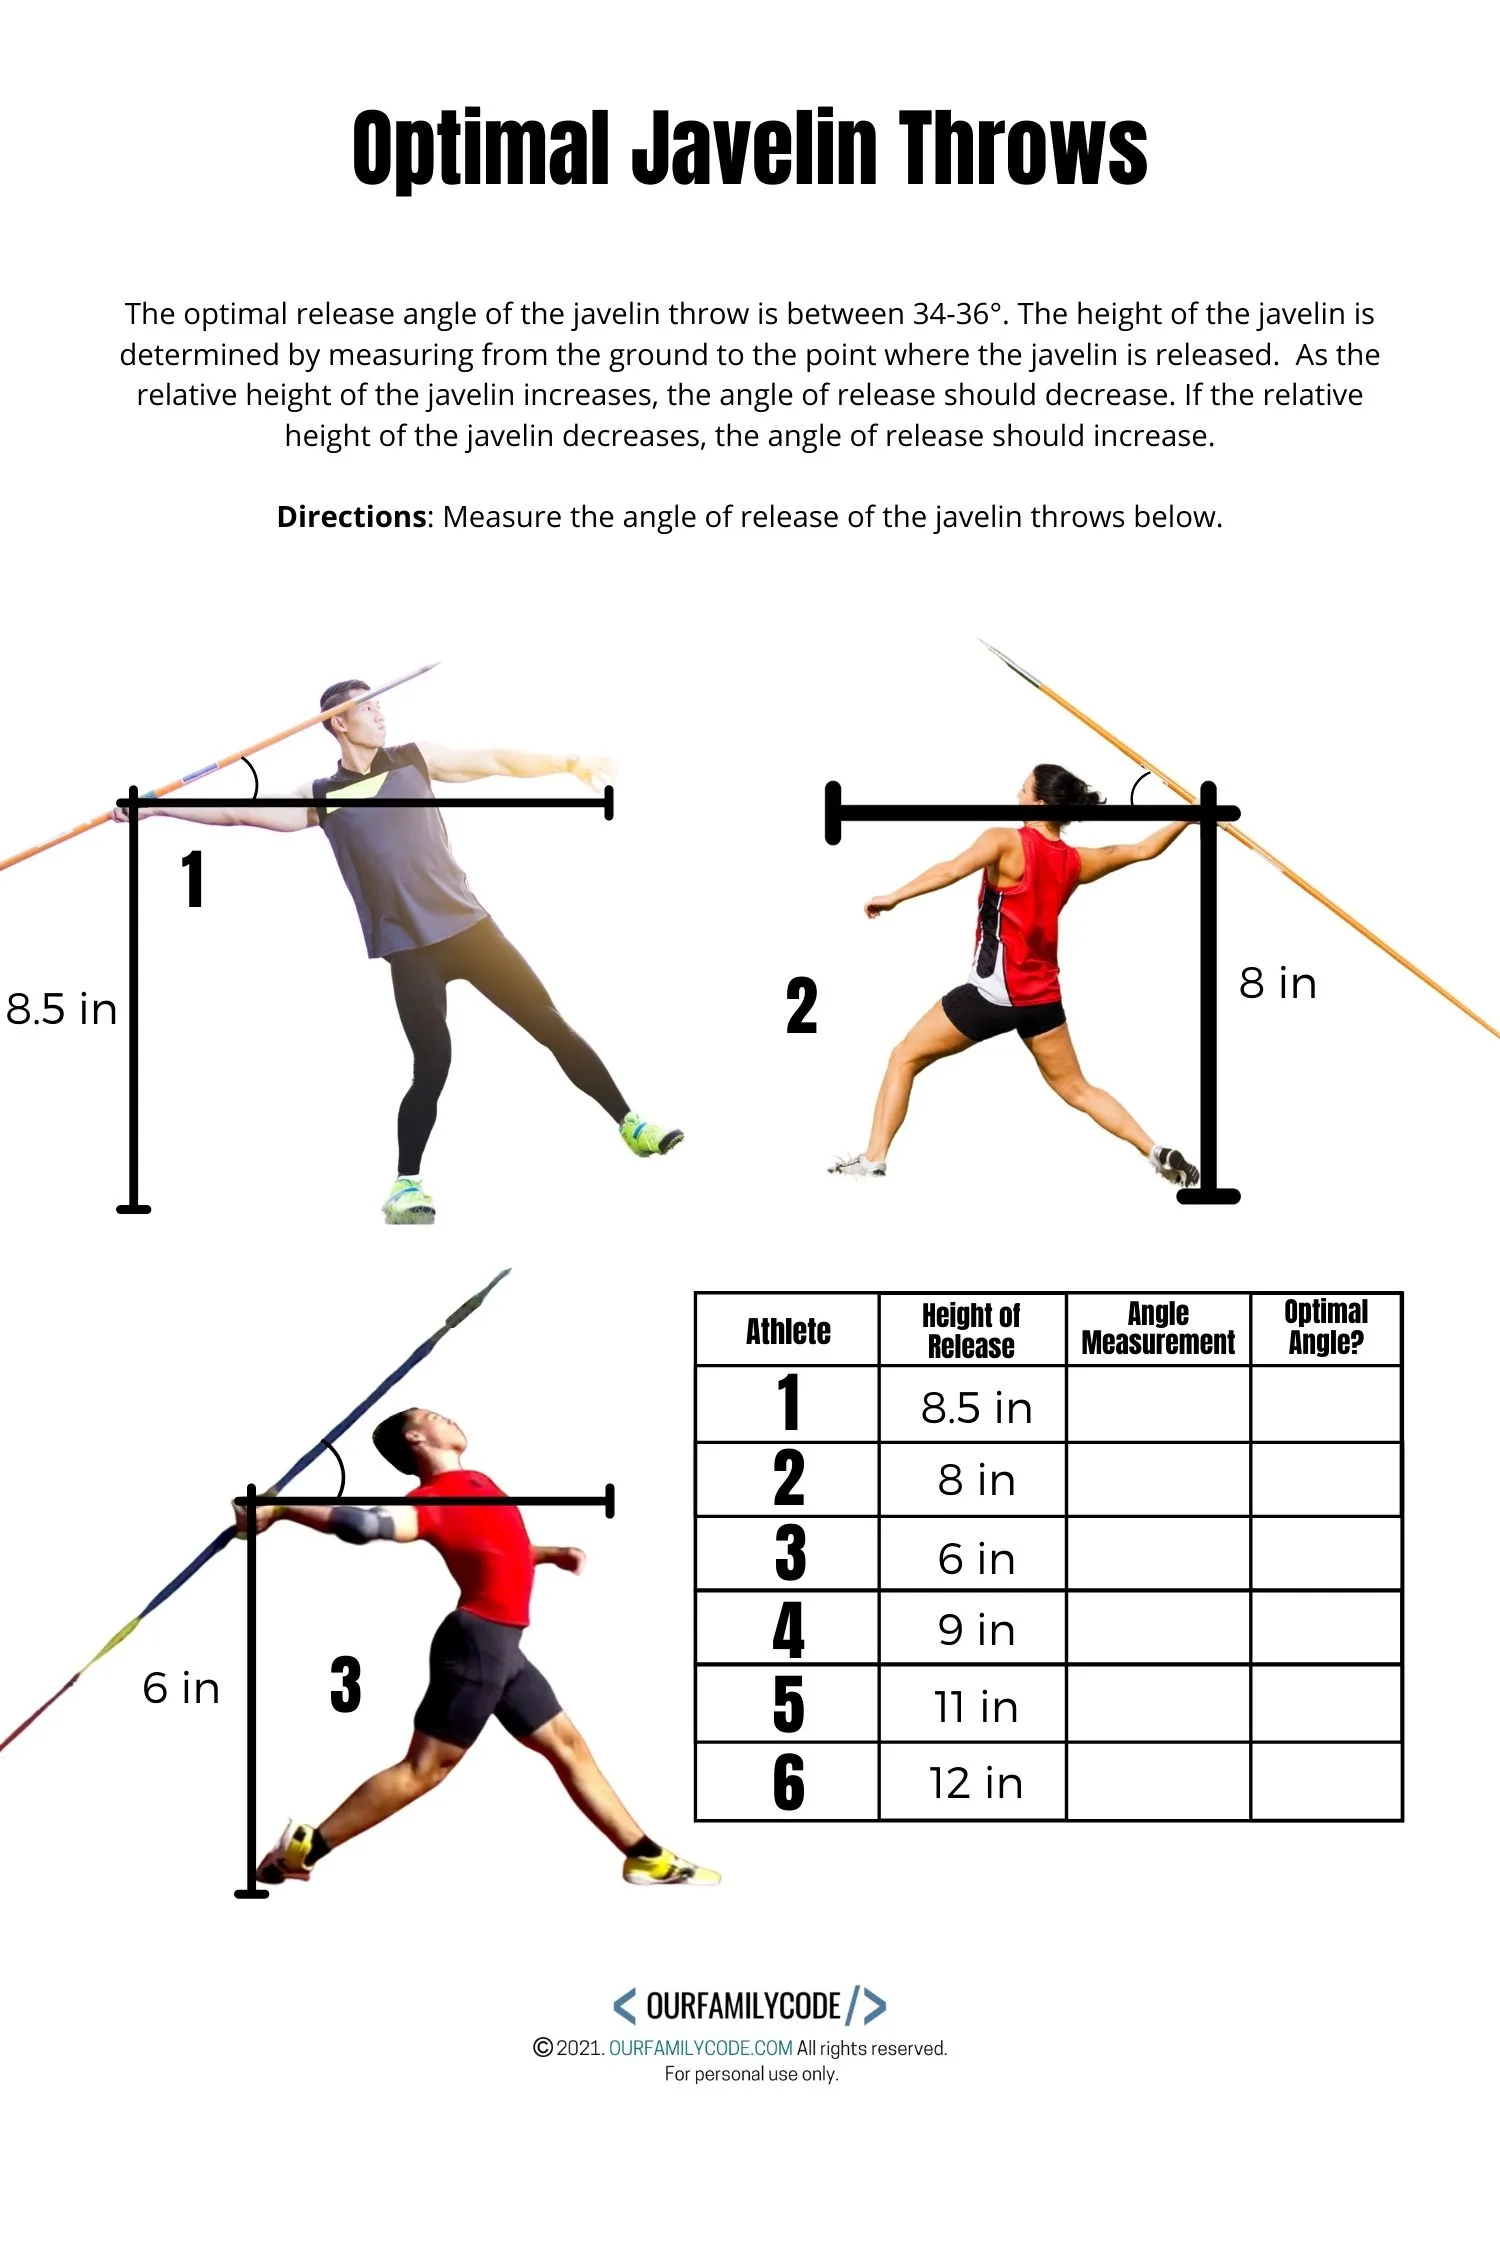
Measure the Angle of Release of each Javelin Throw
Use a protractor to measure the angle of release of the javelin throw. The angle of release is the angle of the javelin to the ground. If you do not have a protractor, there is a printable protractor on the last page of the the free optimal javelin throw workbook.
Measuring Angles
Angles are measure in degrees. A protractor is a mathematics tool that measures how many degrees an angle is. To use a protractor, line up the dot on the center of the bottom of the protractor with the vertex (intersecting point) of the angle.
Make sure that the 0° mark lines up with one arm of the angle and then read the protractor to see where the other arm of the angle lines up.
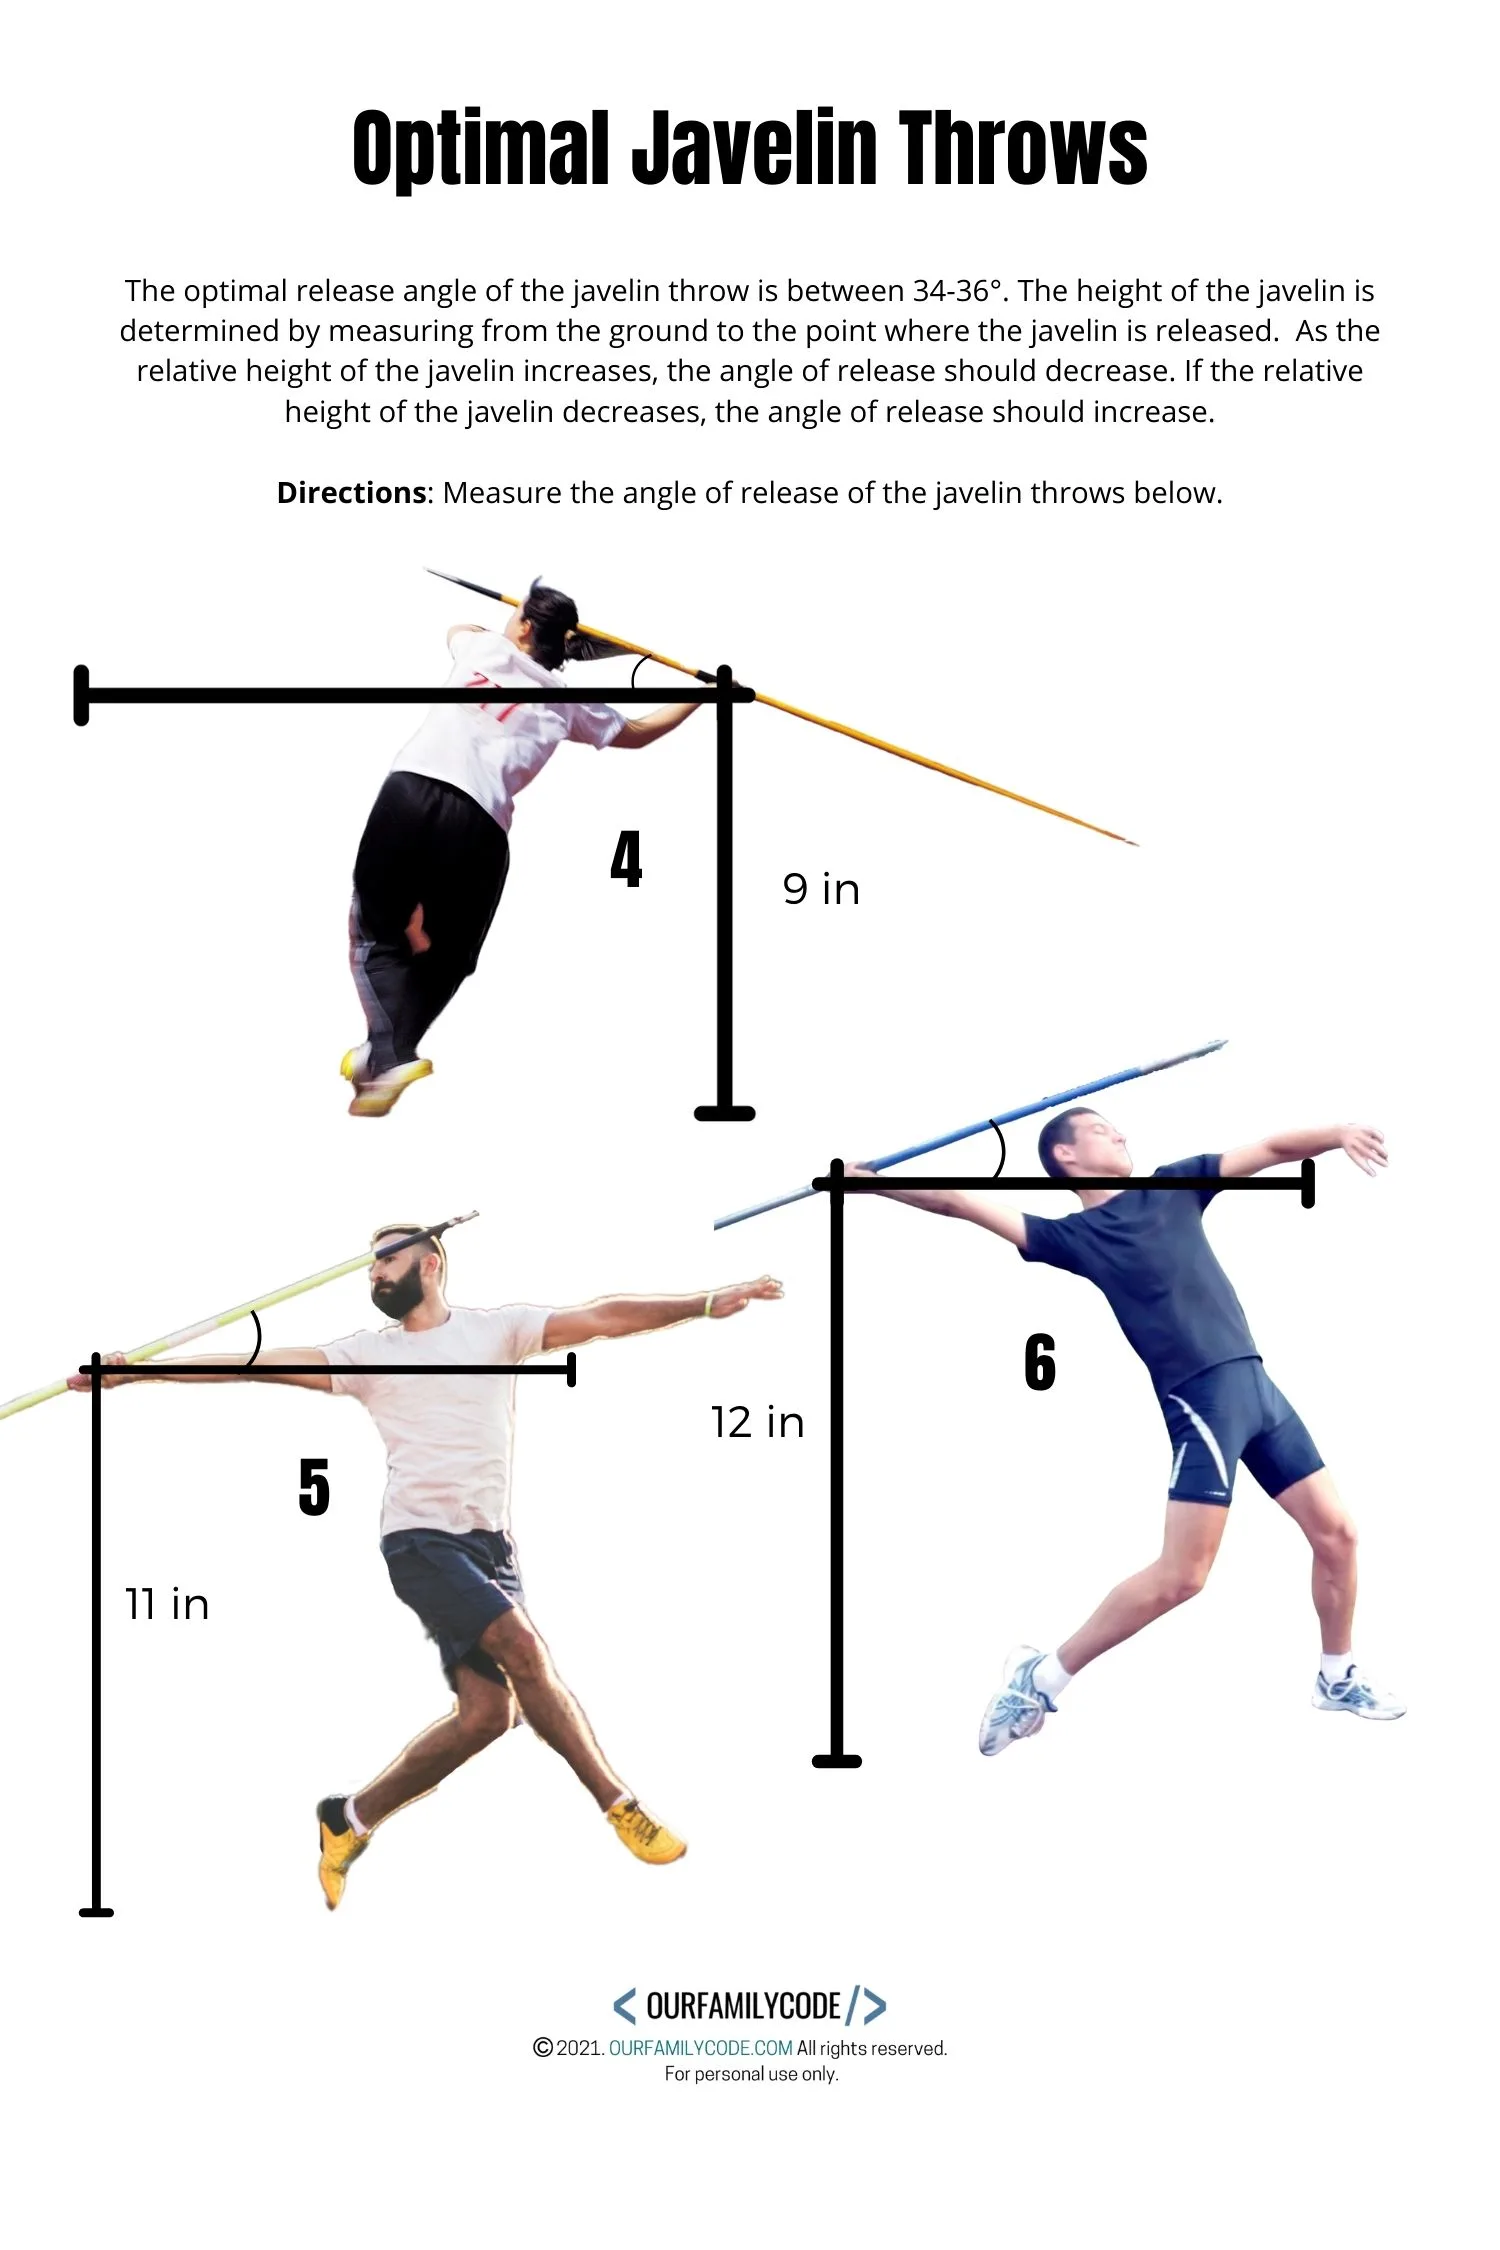
Analyze the Data
Use a bar graph to graph the angle of release of each throw on the vertical axis using the height of release provided on the horizontal axis. Is the relationship between the data a direct or inverse relationship? Does your data form a proportional relationship? Why or why not?
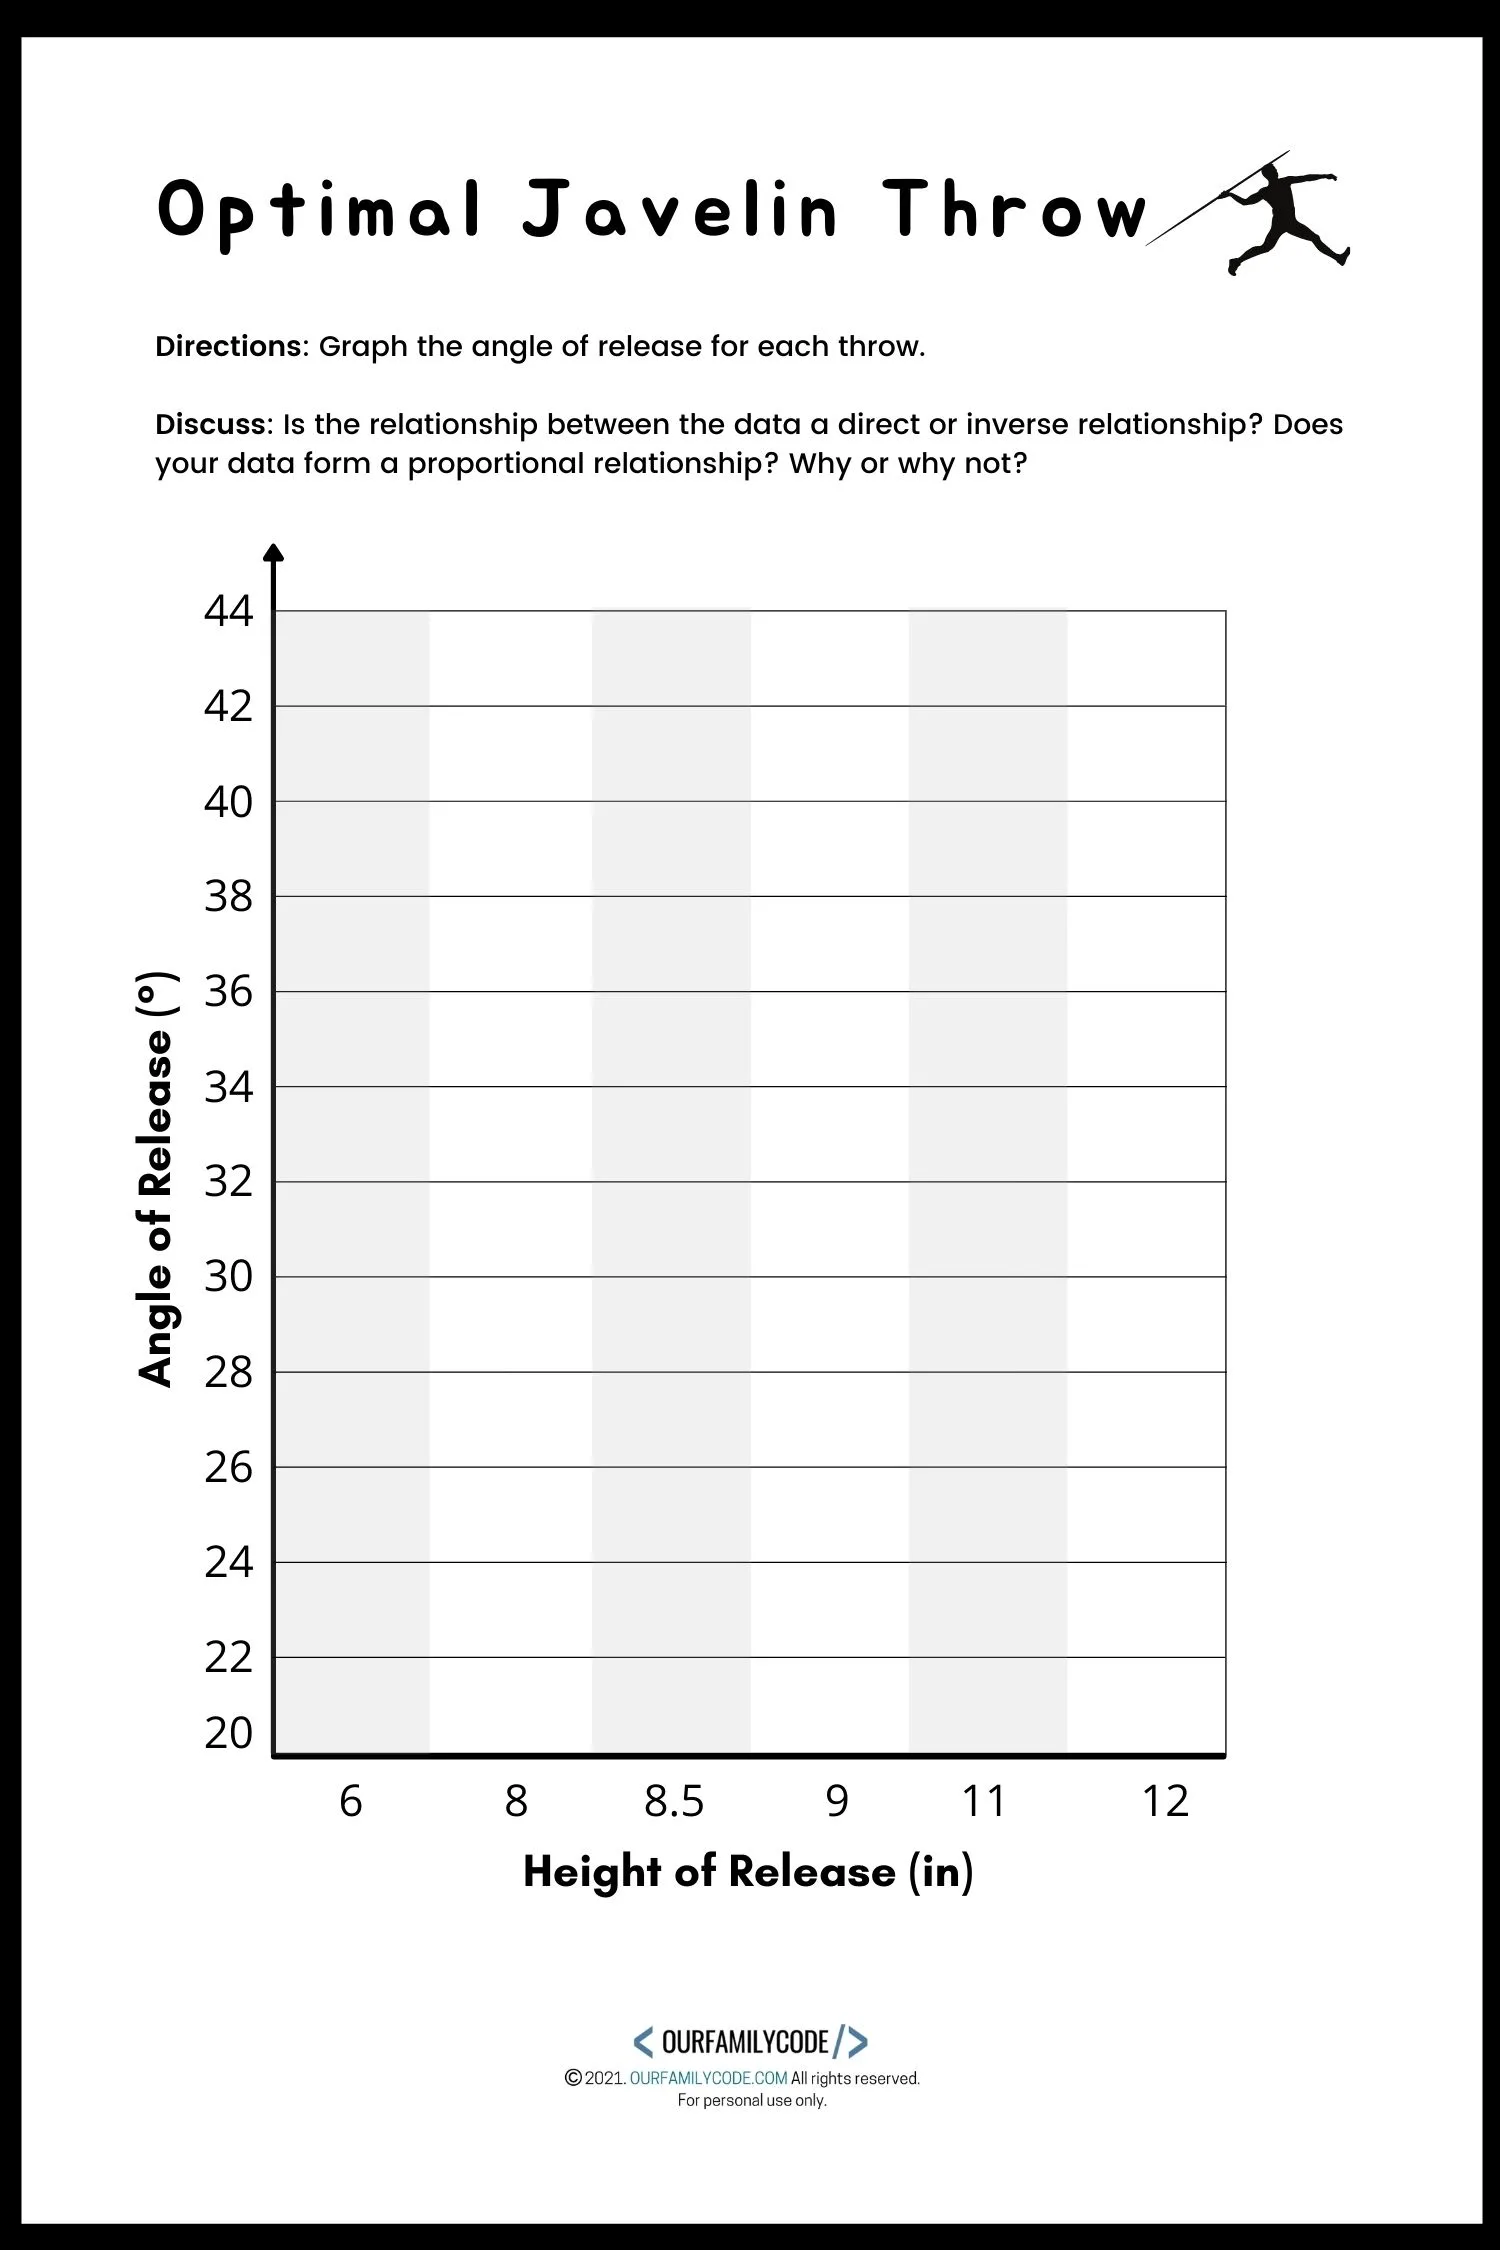
Use a graph to represent the relationship between the data.
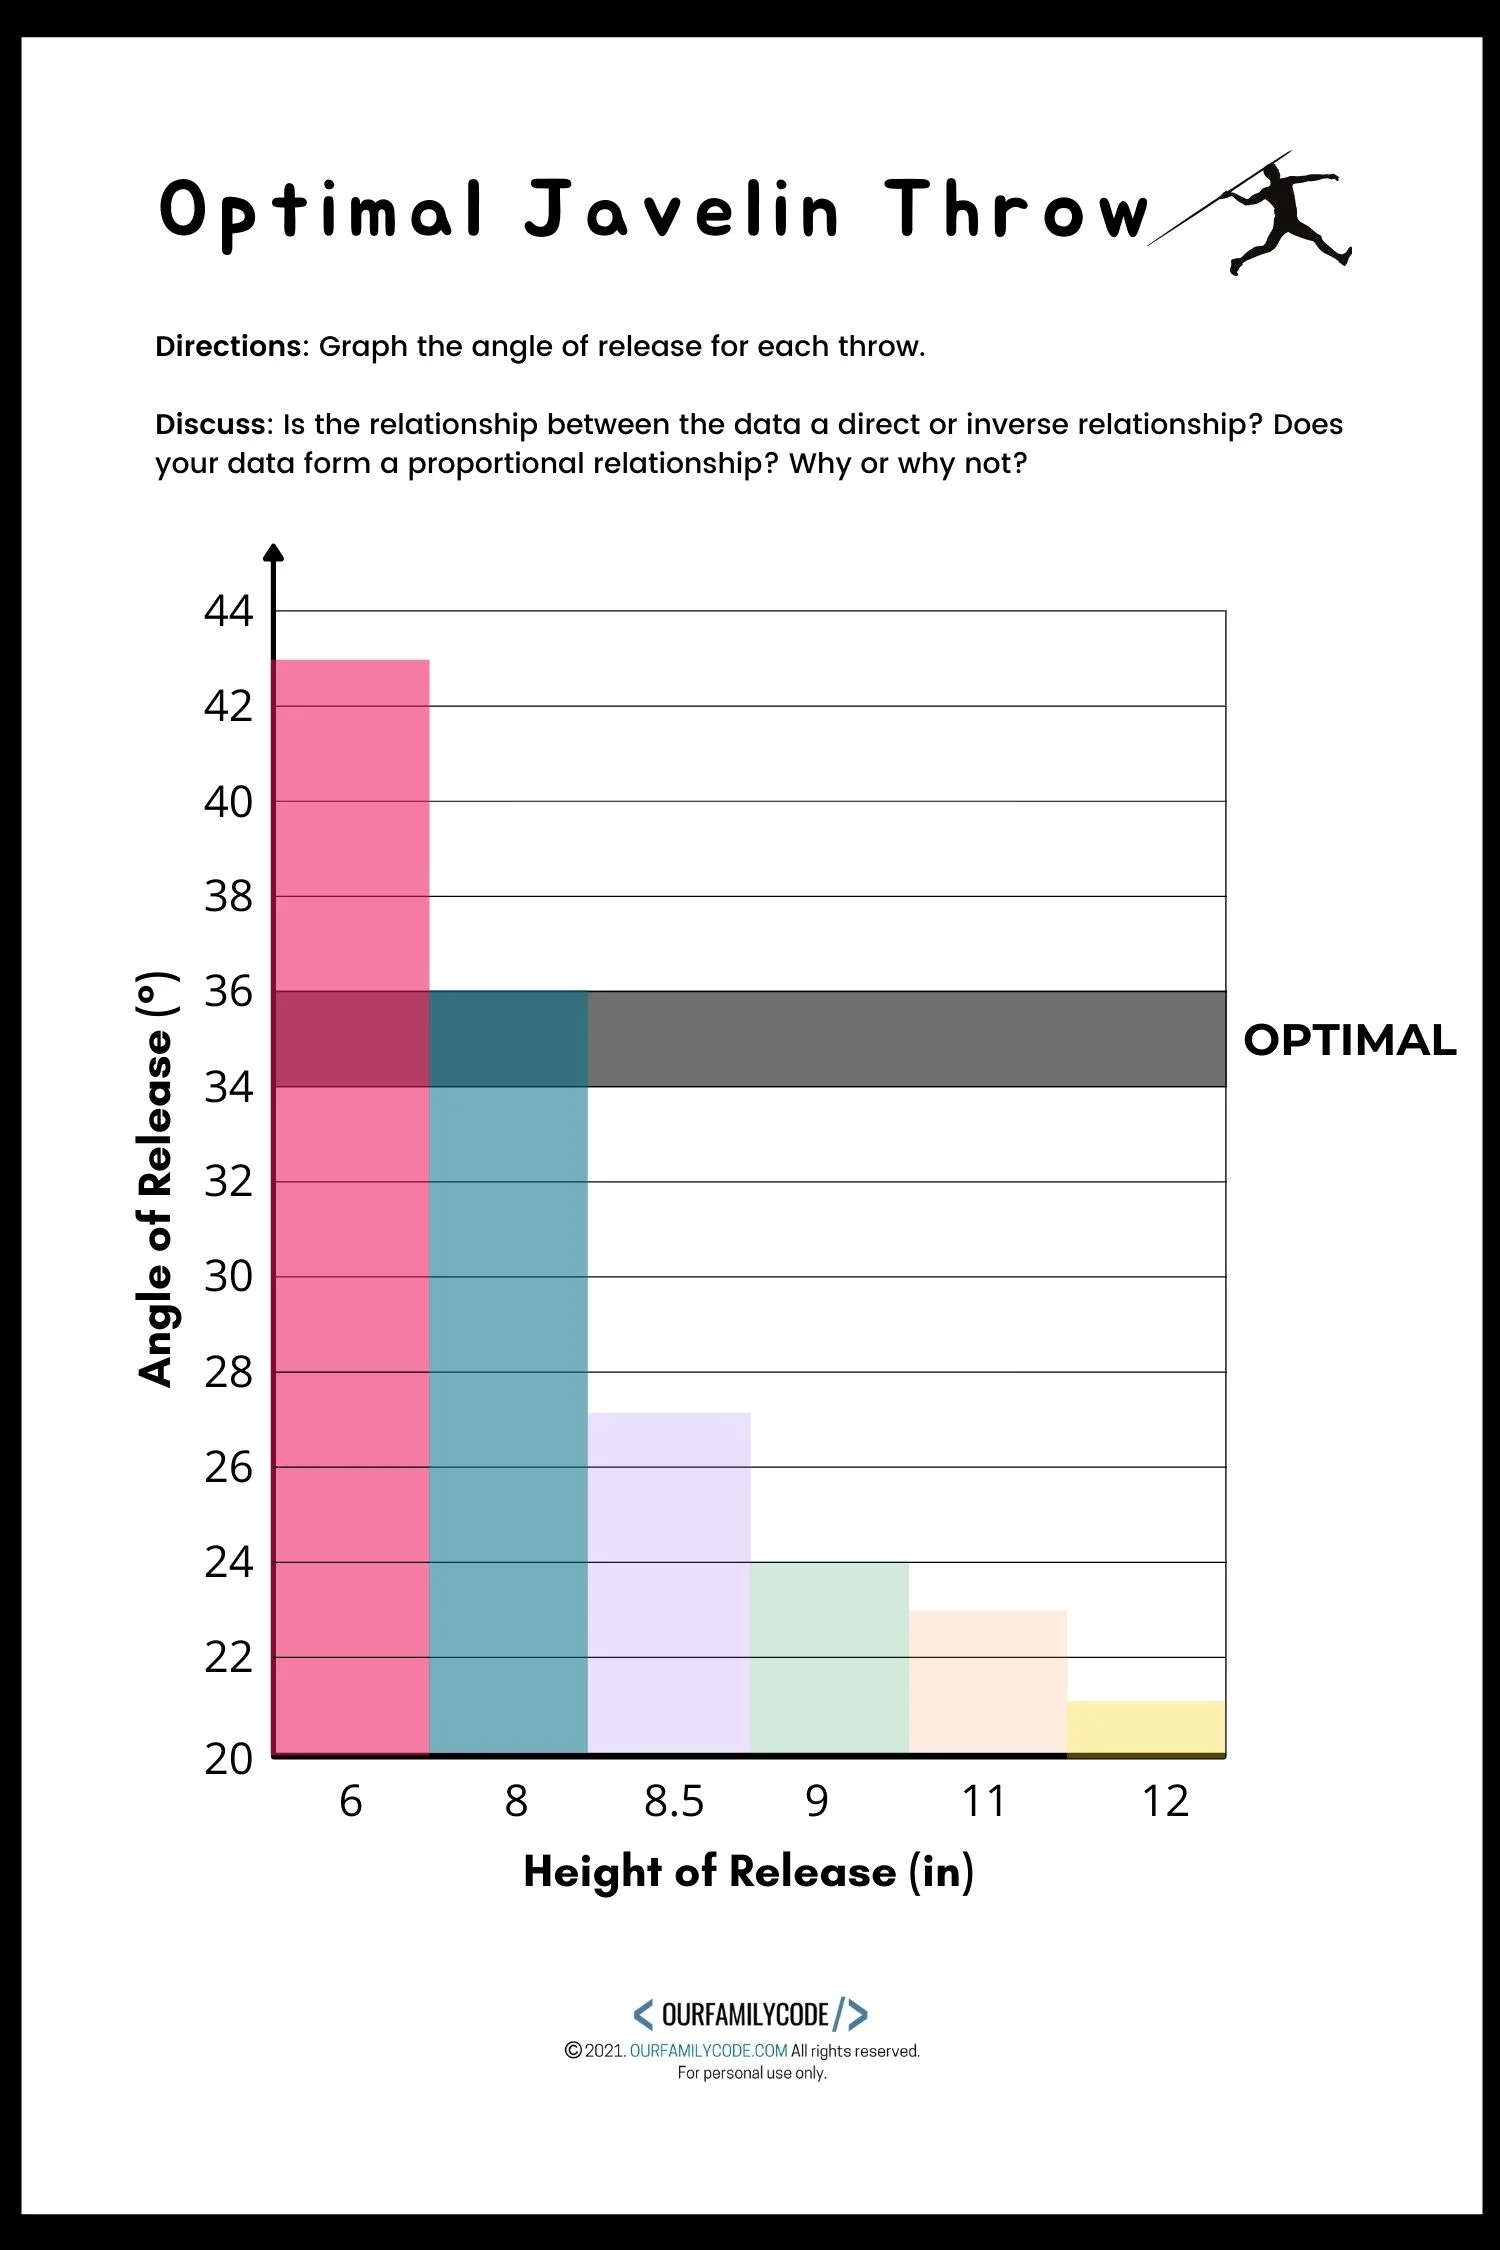
Use a bar graph to visualize the data and determine the relationship between the angle of release and the height of release.
Is the relationship between the data a direct relationship or an inverse relationship? Does the data form a proportional relationship?
What is a Direct Relationship?
A direct relationship occurs when one variable increases, so does the other variable. In this case, if the height of the release increased, the angle of measurement would increase in a direct relationship. The resulting graph would look like a straight line.
What is an Inverse Relationship?
In an inverse relationship, if you increase one variable, the other variable will decrease. This type of relationship forms a curving graph where the decline is fast at first, but slows down as the variables increase. In this activity, as the height of release (x) increases, the angle of measurement (y) does what?
Does the data form a proportional relationship?
No, the data does not form a proportional relationship. There are other factors that determine a javelin throw including wind speed, velocity of the throw, and more. A proportional relationship is one that as one variable (x) changes, the other variable (y) changes by the same percentage. In this activity, the data does not increase or decrease at a constant rate.
Conduct the Activity Outside
For even more fun, use your knowledge of the relationship between height of release and angle of release to practice throwing a “javelin” in your backyard.

You can use a pool noodle, broom stick, or large stick to throw. Measure your distance and see how far the stick travels when you throw at different angles.

Does the real life application follow the data you graphed? Why or why not? My teen conducted the outside experiment. She is 5ft 3in, so she decided to throw her first shot at a normal angle. It was about 35° ish. The broom stick traveled 18ft.
On her second attempt, she opened up her angle to around 45-50° and the broom traveled a whopping 32ft!

Olympic Games Activities for Kids
Find more hands-on learning activities that are perfect for learning about the Olympics!
Olympic Medal Ten Frames Worksheets for Kids
These Olympic medal ten frames math worksheets are fantastic to work on basic number facts with a fun Olympics twist for Pre-K to 1st grade!
Frozen Baseball Experiment Sports STEM
Learn what happens when baseballs get cold and learn the history of how baseballs are made with this frozen baseball experiment Sport STEM activity!
Measure Athlete Angles in Olympic Sports
Athletes use angles to analyze their performance. This sports STEM activity challenges kids to measure athlete angles in Olympic Sports.
Olympic Hundreds Chart: Fill in the Olympic Rings
Practice number recognition and counting within 120 by placing the correct number inside the empty rings on this Olympic hundreds chart!
Team USA Medal Tracker Hundreds Chart to 130
Use this Team USA medal tracker to record each medal that Team USA wins during the Olympic Games and complete a hundreds chart to 130.
Map the Olympic Host Cities World Geography Activity
This world geography activity challenges kids to use technology to map the Olympic host cities since the Summer Olympics started in 1896.
Meet Toni, the Maker Mom behind Our Family Code

Hey there, I’m Toni! I’m a software engineer and Maker Mom that finds my joy in unleashing my children’s curiosity by exploring STEAM concepts with my fantastic five!
When I’m not chasing toddlers or raising tweens, you can find me tearing things up and putting them back together over here at Our Family Code.
I am the owner and content creator of multiple educational websites designed to increase access to STEAM & STEM education with a focus on teaching computer science and coding to kids of all ages!
You can also find out more about me by visiting ToniGardner.com!


